




Call us
301-363-4651 (Available 9 a.m. to 5 p.m. CST from Monday to Friday)

Nutritional metabolic disorders are a group of diseases caused by abnormalities in nutrient metabolism, including but not limited to diabetes, obesity, cardiovascular disease, and fatty liver. Nutritional metabolic diseases are usually associated with an imbalance in the metabolism of nutrients in the body, and may be caused by a variety of factors such as enzyme defects, abnormal hormone levels, genetic factors, or lifestyle.
Drug development for nutrient metabolic diseases focuses on several key targets, and the following are some of the important targets and their R&D progress:

Human TNFSF13B protein Fc tag (CSB-MP897523HU1) captured on COOH chip can bind Human BCMA protein Fc tag (CSB-MP023974HU1) with an affinity constant of 39 nM as detected by LSPR Assay.

Human GH1 protein his/myc tag (CSB-MP009407HU) captured on COOH chip can bind Human GHR protein Fc tag (CSB-MP009411HU) with an affinity constant of 6.1 nM as detected by LSPR Assay.
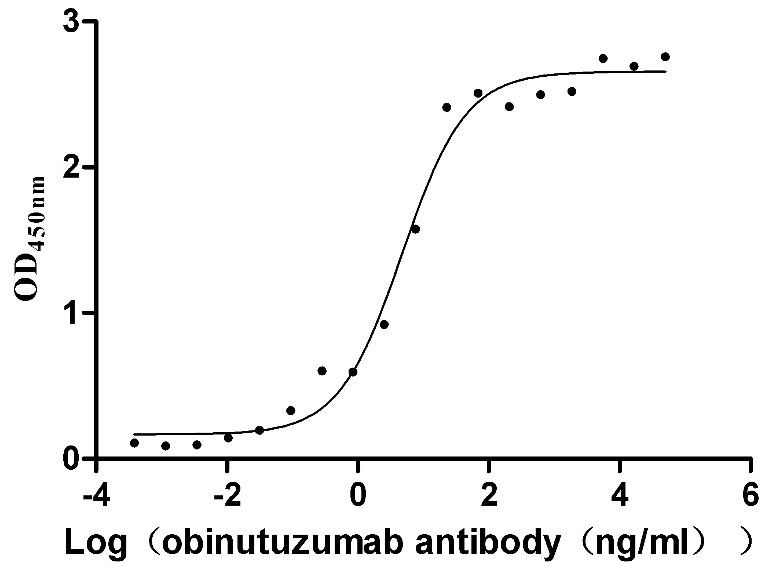
Measured by its binding ability in a functional ELISA. Immobilized human CD20 at 2 μg/ml can bind Anti-CD20 recombinant antibody (CSB-RA015007A1HU), the EC50 is 3.243-7.085 ng/mL
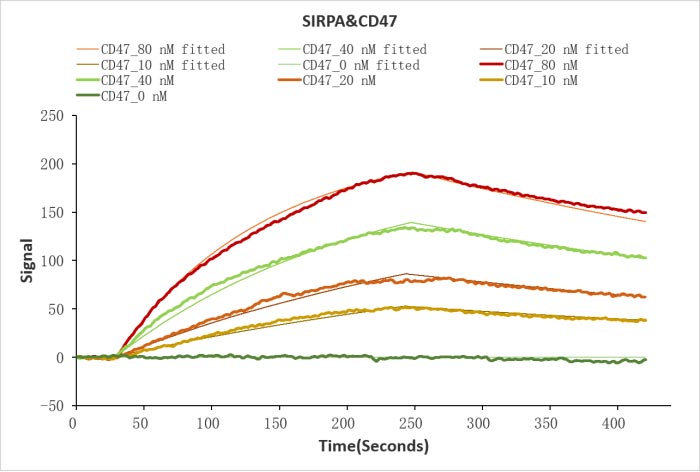
Human SIRPA protein His/Myc tag (CSB-MP021334HU) captured on COOH chip can bind Human CD47 protein Fc tag (CSB-MP004940HU) with an affinity constant of 19.1 nM as detected by LSPR Assay.

Measured by its binding ability in a functional ELISA. Immobilized Human GPRC5D at 5 μg/mL can bind Anti-GPRC5D recombinant antibody (CSB-RA882153MA01HU), the EC50 is 8.847-10.38 ng/mL.
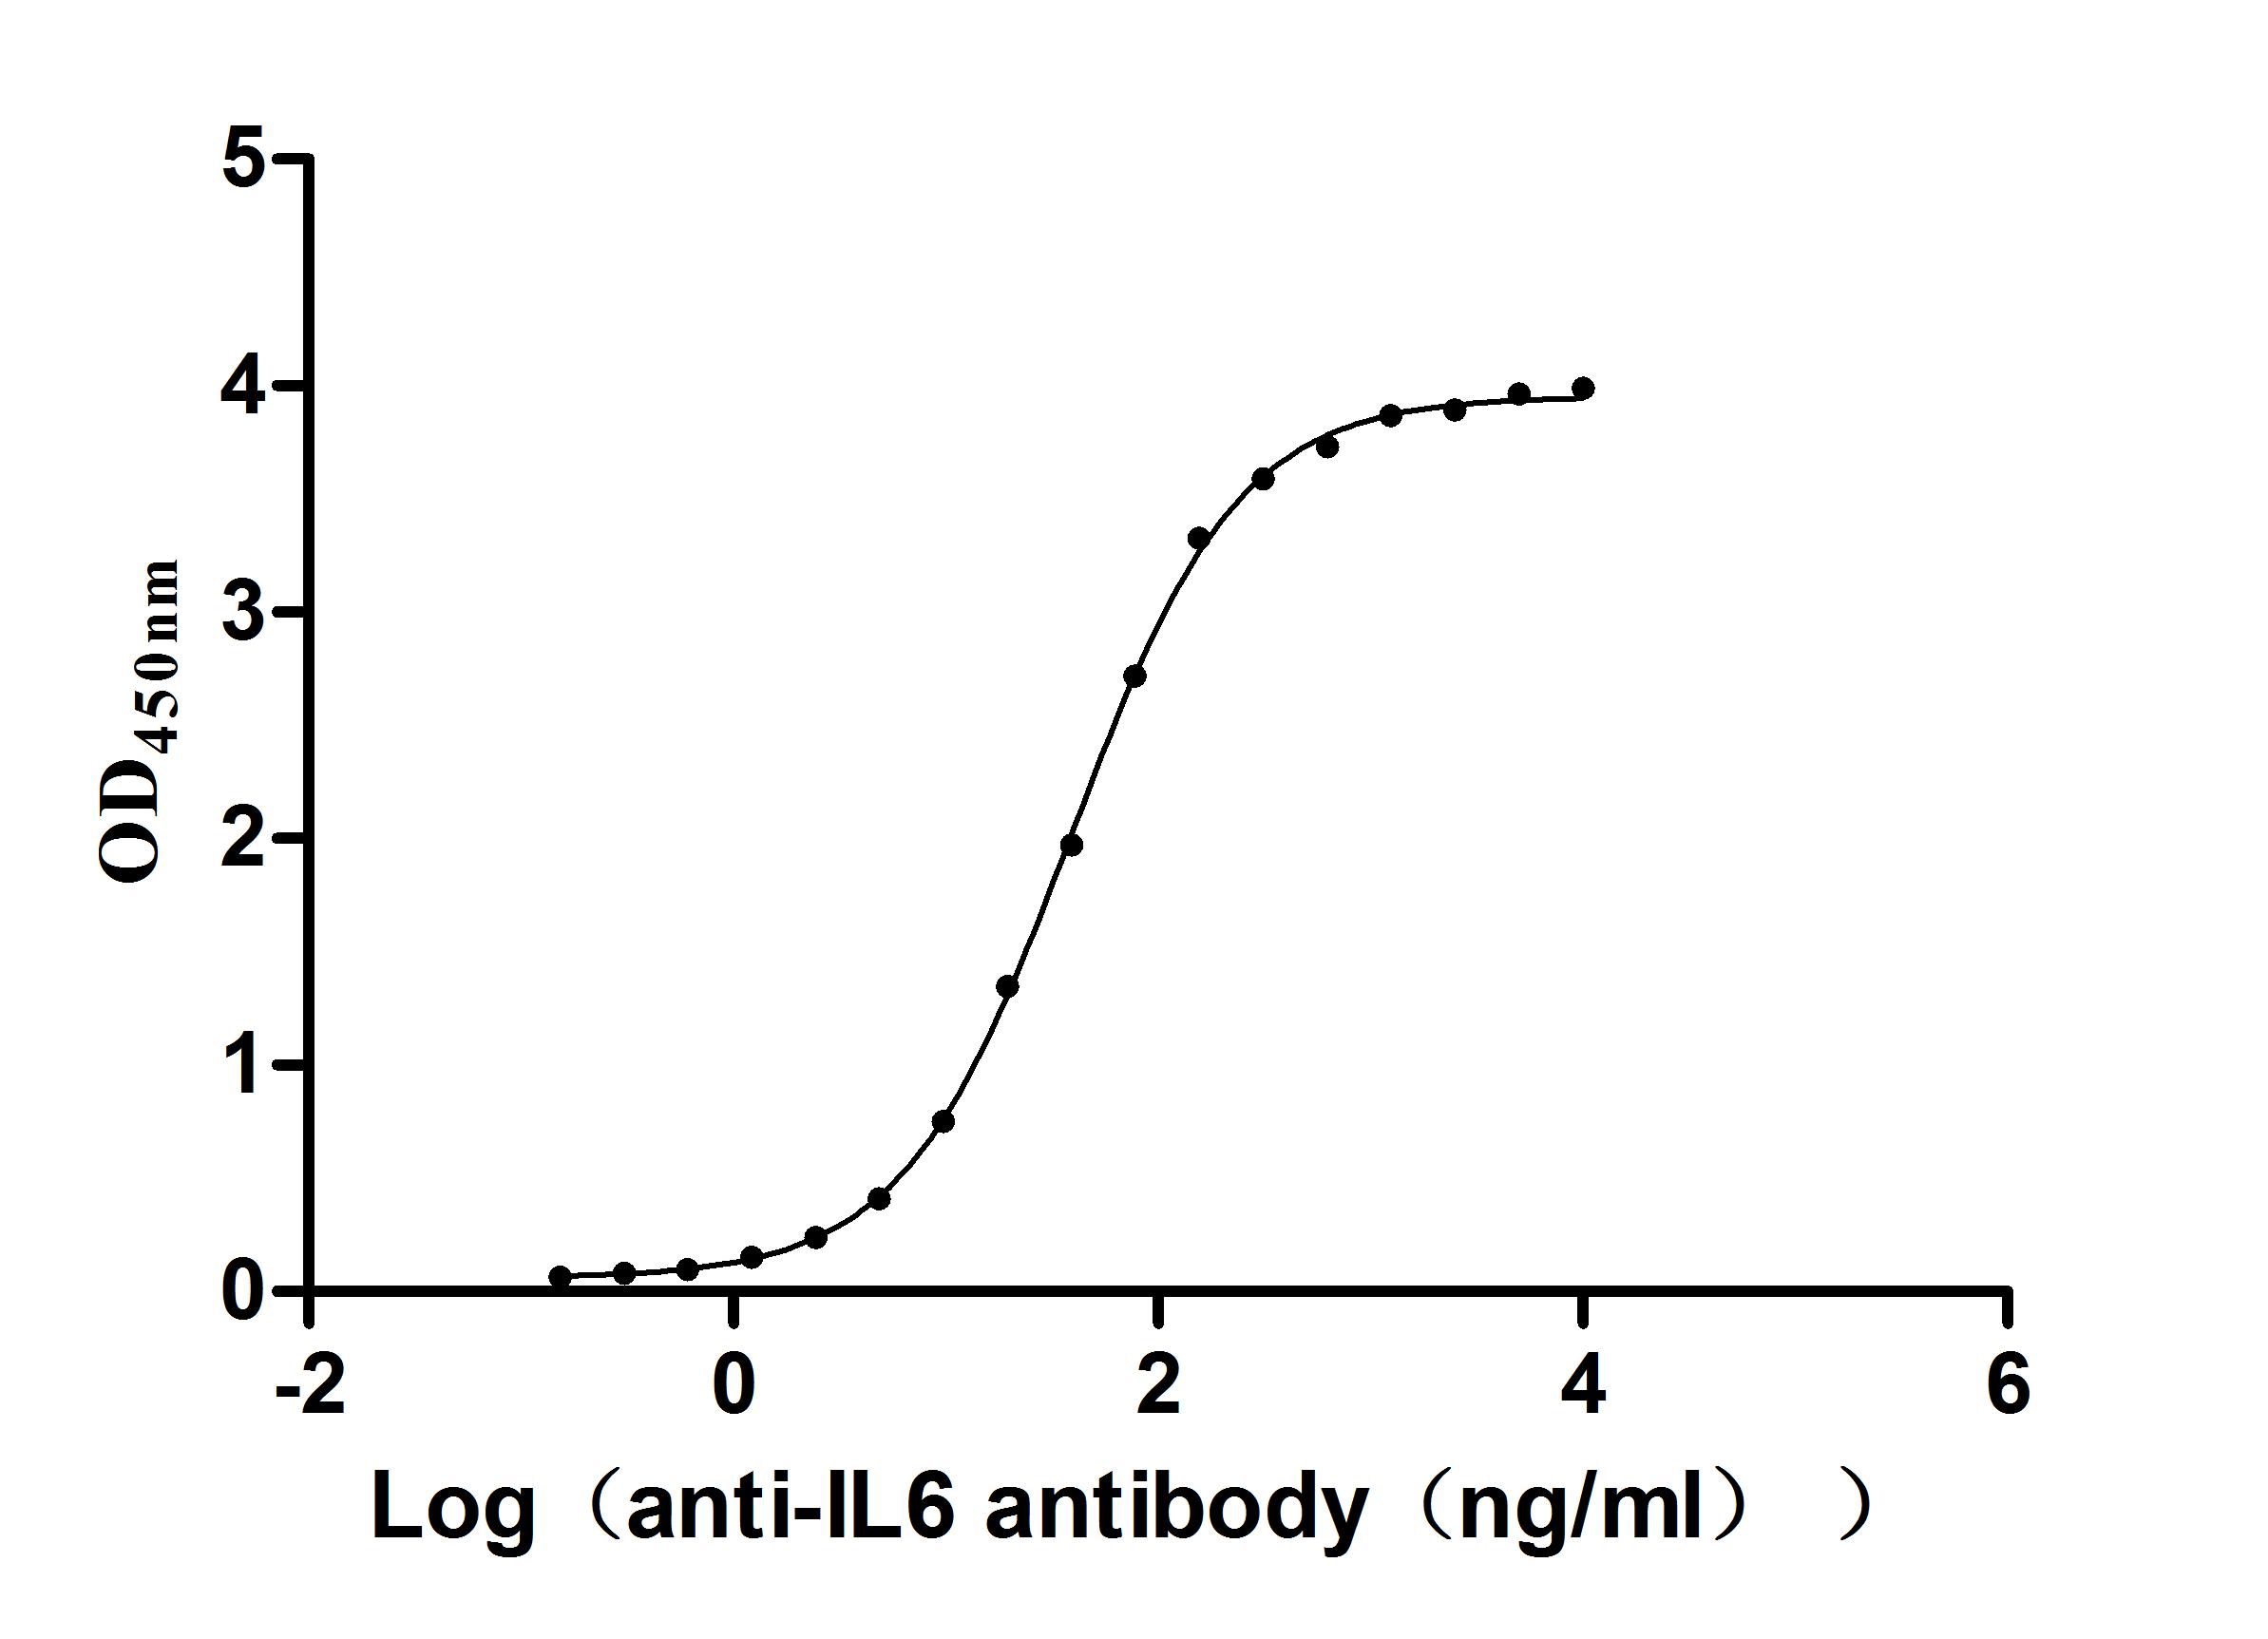
Measured by its binding ability in a functional ELISA. Immobilized Human IL6 at 2μg/mL can bind Anti-IL6 recombinant antibody (CSB-RA011664MA1HU),the EC50 is 35.80-41.82 ng/mL.
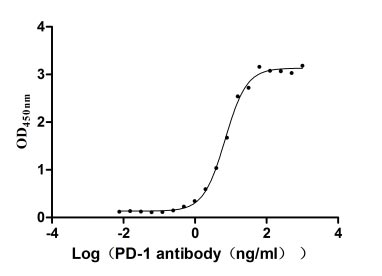
Measured by its binding ability in a functional ELISA. Immobilized PD-1 at 2 μg/ml can bind Anti-PD-1 recombinant antibody, the EC50 of human PD-1 protein is 6.087-7.854 ng/ml.
-AC1.jpg)
Measured by its binding ability in a functional ELISA. Immobilized Human ANGPT2 at 2 μg/ml can bind anti-ANGPT2 recombinant antibody(CSB-RA001707MA01HU), the EC50 is 0.6666-0.8876 ng/mL
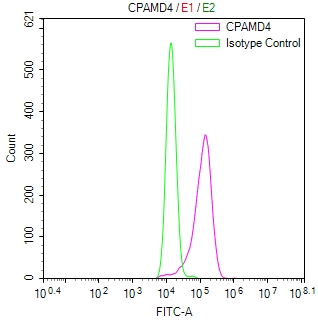
Overlay Peak curve showing Hela cells surface stained with CSB-RA003995MA1HU (red line) at 1:800.
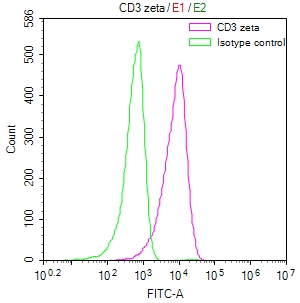
Overlay Peak curve showing Jurkat cells surface stained with CSB-RA244537A0HU (red line) at 1:50.
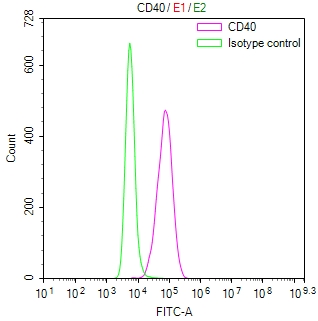
Overlay Peak curve showing THP-1 cells surface stained with CSB-RA004936MA1HU (red line) at 1:100.
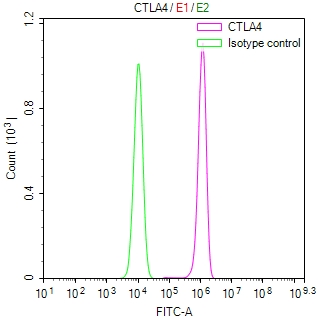
Overlay Peak curve showing JK cells surface stained with CSB-RA006163MA1HU (red line) at 1:50.
Tumour


