


Call us
301-363-4651 (Available 9 a.m. to 5 p.m. CST from Monday to Friday)
NCongenital Hereditary Neonatal Diseases and Malformations are newborn health problems caused by genetic factors that may be present at birth or early in life. They include metabolic disorders, blood disorders, congenital heart disease, and neural tube defects.
Currently, drug development for congenital hereditary neonatal diseases and malformations is being actively explored, focusing on the following directions:
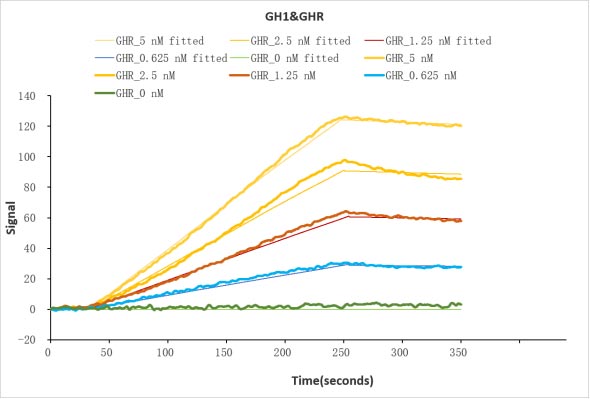
Human GH1 protein his/myc tag (CSB-MP009407HU) captured on COOH chip can bind Human GHR protein Fc tag (CSB-MP009411HU) with an affinity constant of 6.1 nM as detected by LSPR Assay.
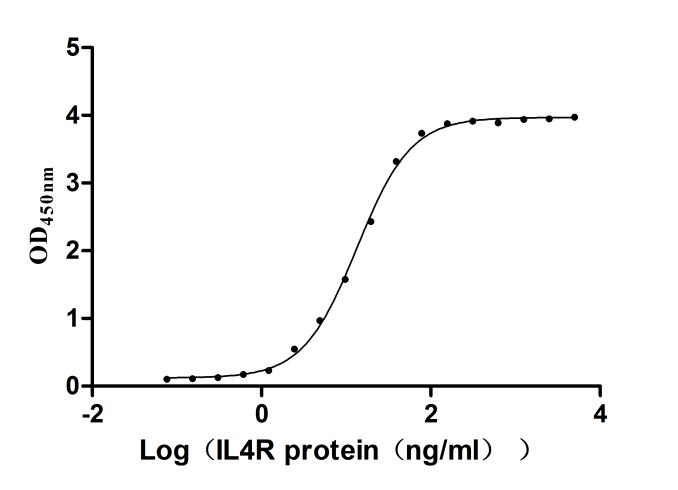
Measured by its binding ability in a functional ELISA. Immobilized Human IL4 (CSB-MP011659HU) at 2μg/mL can bind biotinylated Human IL4R,the EC50 is 12.68-14.23 ng/mL.

Measured by its binding ability in a functional ELISA. Immobilized Human TFPI at 1 μg/ml can bind Anti-TFPI recombinant antibody (CSB-RA023437MA01HU), the EC50 is 1.242-1.788 ng/mL.

Measured by its binding ability in a functional ELISA. Immobilized PD-1 at 2 μg/ml can bind Anti-PD-1 recombinant antibody, the EC50 of human PD-1 protein is 6.087-7.854 ng/ml.
Measured by its binding ability in a functional ELISA. Immobilized Human TFRC at 2μg/mL can bind Anti-TFRC recombinant antibody (CSB-RA023441MA1HU), the EC50 is 3.305-8.220 ng/mL.

Measured by its binding ability in a functional ELISA. Immobilized Human GLP1R at 2 μg/mL can bind Anti-GLP1R recombinant antibody (CSB-RA009514MA1HU), the EC50 is 54.54-94.23 ng/mL.

Measured by its binding ability in a functional ELISA. Immobilized Human IL2RA at 2μg/mL can bind Anti-IL2RA recombinant antibody (CSB-RA011649MA1HU),the EC50 is 2.463-3.353 ng/mL.

Measured by its binding ability in a functional ELISA. Immobilized CD276 at 2 μg/ml can bind Anti-CD276 rabbit monoclonal antibody, the EC50 of human CD276 protein is 1.961-2.243 ng/ml.

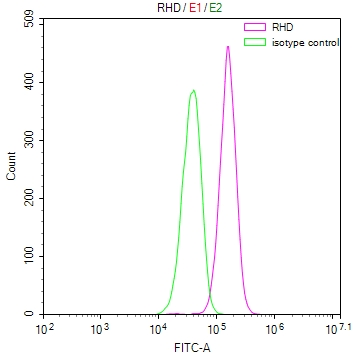
Overlay Peak curve showing Hela cells surface stained with CSB-RA011087MA1HU (red line) at 1:50.
Overlay Peak curve showing Hela cells surface stained with CSB-RA019677MA1HU (red line) at 1:100.

Overlay Peak curve showing NIH/3T3 cells surface stained with CSB-RA011621MA1HU (red line) at 1:50.

Overlay Peak curve showing Hela cells surface stained with CSB-RA003995MA1HU (red line) at 1:800.
Tumour