


Call us
301-363-4651 (Available 9 a.m. to 5 p.m. CST from Monday to Friday)
Intra-assay Precision (Precision within an assay): CV%<8% | ||||||||||||||||||||||||||||||||||||||||||||||||||
Three samples of known concentration were tested twenty times on one plate to assess. | ||||||||||||||||||||||||||||||||||||||||||||||||||
Inter-assay Precision (Precision between assays): CV%<10% | ||||||||||||||||||||||||||||||||||||||||||||||||||
Three samples of known concentration were tested in twenty assays to assess. | ||||||||||||||||||||||||||||||||||||||||||||||||||
| ||||||||||||||||||||||||||||||||||||||||||||||||||
To assess the linearity of the assay, samples were spiked with high concentrations of human IL-18BP in various matrices and diluted with the Sample Diluent to produce samples with values within the dynamic range of the assay. | |||||||||
| Sample | Serum(n=4) | |||||||
1:10 | Average % | 100 | |||||||
Range % | 95-104 | ||||||||
1:20 | Average % | 84 | |||||||
Range % | 80-88 | ||||||||
1:40 | Average % | 98 | |||||||
Range % | 92-103 | ||||||||
1:80 | Average % | 90 | |||||||
Range % | 85-97 | ||||||||
The recovery of human IL-18BP spiked to levels throughout the range of the assay in various matrices was evaluated. Samples were diluted prior to assay as directed in the Sample Preparation section. | |||||||||
Sample Type | Average % Recovery | Range | |||||||
Serum (n=5) | 95 | 90-100 | |||||||
EDTA plasma (n=4) | 93 | 89-98 | |||||||
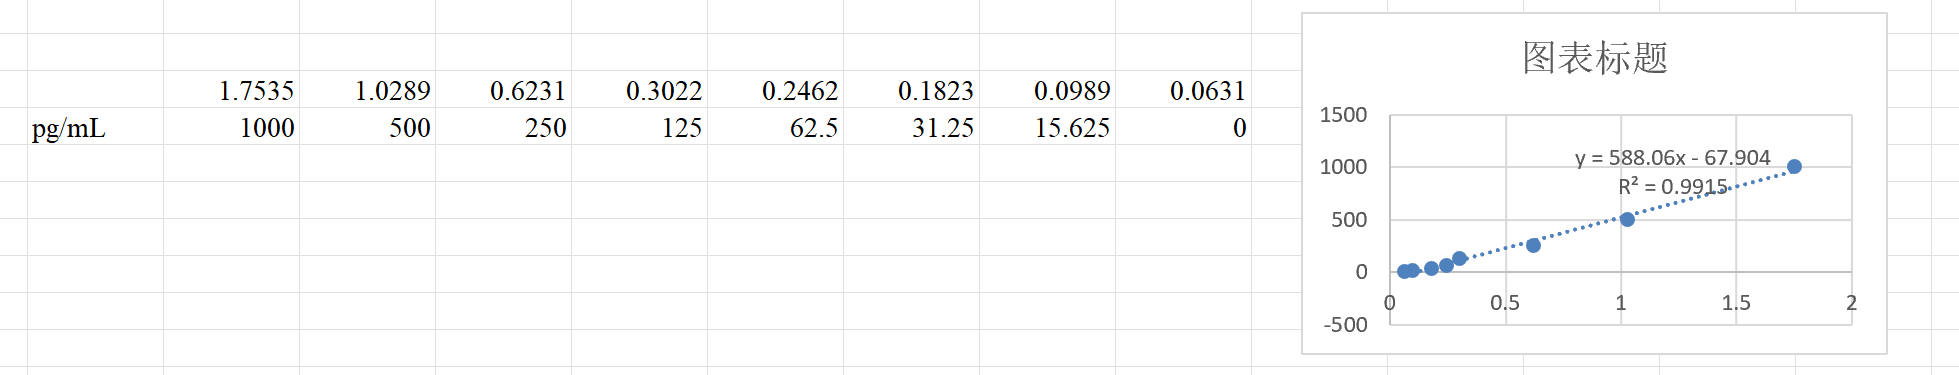
These standard curves are provided for demonstration only. A standard curve should be generated for each set of samples assayed. | |||||||||
| |||||||||
pg/ml | OD1 | OD2 | Average | Corrected | |||||
1000 | 2.412 | 2.624 | 2.518 | 2.412 | |||||
500 | 1.845 | 1.952 | 1.899 | 1.793 | |||||
250 | 1.181 | 1.124 | 1.153 | 1.047 | |||||
125 | 0.685 | 0.645 | 0.665 | 0.559 | |||||
62.5 | 0.371 | 0.393 | 0.382 | 0.276 | |||||
31.2 | 0.234 | 0.223 | 0.229 | 0.123 | |||||
15.6 | 0.169 | 0.162 | 0.166 | 0.060 | |||||
0 | 0.107 | 0.105 | 0.106 |
| |||||
Sample species :
Sample type:
Sample dilution:
Review:
By Anonymous